利用html5 canvas动态画饼状图的示例代码
|
这里并没引用jquery等第三方库,只是用dom操作和canvas的特性编写的。 canvas画圆大体分为实心圆和空心圆。 根据需求分析知道该圆为实心圆。 1.先用canvas画实心圆
//伪代码 var canvas = document.createElement("canvas"); var ctx = canvas.getContext('2d'); ctx.beginPath(); ctx.arc(圆心x轴坐标,圆心y轴坐标,半径,开始角,结束角); ctx.fillStyle = 'green'; ctx.closePath(); ctx.fill(); 2.根据不同颜色绘制饼状图 //伪代码 var canvas = document.createElement("canvas"); var ctx = canvas.getContext('2d'); ctx.beginPath(); ctx.arc(圆心x轴坐标,圆心y轴坐标,半径,绿色开始角,绿色结束角); ctx.fillStyle = 'green'; ctx.closePath(); ctx.fill(); ctx.beginPath(); ctx.arc(圆心x轴坐标,圆心y轴坐标,半径,红色开始角,红色结束角); ctx.fillStyle = 'red'; ctx.closePath(); ctx.fill(); ctx.beginPath(); ctx.arc(圆心x轴坐标,圆心y轴坐标,半径,黄色开始角,黄色结束角); ctx.fillStyle = 'yellow'; ctx.closePath(); ctx.fill(); ctx.beginPath(); ctx.arc(圆心x轴坐标,圆心y轴坐标,半径,紫色开始角,紫色结束角); ctx.fillStyle = 'purple'; ctx.closePath(); ctx.fill(); 3.动态绘制饼状图 动态绘制圆网上普遍推荐三种方法:requestAnimationFrame、setInterval(定时)、还有动态算角度的。 这里我用的是第一种requestAnimationFrame方式。 在编写的过程中发现一个问题,就是动态画圆时并不是以圆心的坐标画的。为了解决这一问题,需要在每次画圆时重新将canvas的画笔的坐标定义为最初圆心的坐标。 <!DOCTYPE html> <html> <head> <meta charset="utf-8"> <title></title> <style> #graph { /* border: 1px solid black; height: 100%; width: 100%; box-sizing: border-box;*/ } </style> </head> <body> <div id="circle" style="width: 500px;float: left;"></div> </body> </html> <script type="text/javascript"> (function(window,undefined){ var data = [ {"product":"产品1","sales":[192.44 ,210.54 ,220.84 ,230.11 ,220.85 ,210.59 ,205.49 ,200.55 ,195.71 ,187.46 ,180.66 ,170.90]}, {"product":"产品2","sales":[122.41 ,133.16 ,145.65 ,158.00 ,164.84 ,178.62 ,185.70 ,190.13 ,195.53 ,198.88 ,204.32 ,210.91]}, {"product":"产品3","sales":[170.30 ,175.00 ,170.79 ,165.10 ,165.62 ,160.92 ,155.92 ,145.77 ,145.17 ,140.27 ,135.99 ,130.33]}, {"product":"产品4","sales":[165.64 ,170.15 ,175.10 ,185.32 ,190.90 ,190.01 ,187.05 ,183.74 ,177.24 ,181.90 ,179.54 ,175.98]} ] var dom_circle = document.getElementById('circle'); if(dom_circle != undefined && dom_circle != null) { var canvas = document.createElement("canvas"); dom_circle.appendChild(canvas); var ctx = canvas.getContext('2d'); var defaultStyle = function(Dom,canvas){ if(Dom.clientWidth <= 300) { canvas.width = 300; Dom.style.overflowX = "auto"; } else{ canvas.width = Dom.clientWidth; } if(Dom.clientHeight <= 300) { canvas.height = 300; Dom.style.overflowY = "auto"; } else { canvas.height = Dom.clientHeight; } //坐标轴区域 //注意,实际画折线图区域还要比这个略小一点 return { p1:'green', p2:'red', p3:'yellow', p4:'purple', x: 0 , //坐标轴在canvas上的left坐标 y: 0 , //坐标轴在canvas上的top坐标 maxX: canvas.width , //坐标轴在canvas上的right坐标 maxY: canvas.height , //坐标轴在canvas上的bottom坐标 r:(canvas.width)/2, //起点 ry:(canvas.height)/2, //起点 cr: (canvas.width)/4, //半径 startAngle:-(1/2*Math.PI), //开始角度 endAngle:(-(1/2*Math.PI)+2*Math.PI), //结束角度 xAngle:1*(Math.PI/180) //偏移量 }; } //画圆 var tmpAngle = -(1/2*Math.PI); var ds = null; var sum = data[0]['sales'][0]+data[0]['sales'][1]+data[0]['sales'][2]+data[0]['sales'][3] var percent1 = data[0]['sales'][0]/sum * Math.PI * 2 ; var percent2 = data[0]['sales'][1]/sum * Math.PI * 2 + percent1; var percent3 = data[0]['sales'][2]/sum * Math.PI * 2 + percent2; var percent4 = data[0]['sales'][3]/sum * Math.PI * 2 + percent3; console.log(percent1); console.log(percent2); console.log(percent3); console.log(percent4); var tmpSum = 0; var drawCircle = function(){ if(tmpAngle >= ds.endAngle) { return false; } else if(tmpAngle+ ds.xAngle > ds.endAngle) { tmpAngle = ds.endAngle; } else{ tmpAngle += ds.xAngle; tmpSum += ds.xAngle } // console.log(ds.startAngle+'***'+tmpAngle); // console.log(tmpSum); // ctx.clearRect(ds.x,ds.y,canvas.width,canvas.height); if(tmpSum > percent1 && tmpSum <percent2) { ctx.beginPath(); ctx.moveTo(ds.r,ds.ry); ctx.arc(ds.r,ds.ry,ds.cr,ds.startAngle+percent1,tmpAngle); ctx.fillStyle = ds.p2; } else if(tmpSum > percent2 && tmpSum <percent3) { ctx.beginPath(); ctx.moveTo(ds.r,ds.ry); ctx.arc(ds.r,ds.ry,ds.cr,ds.startAngle+percent2,tmpAngle); ctx.fillStyle = ds.p3; } else if(tmpSum > percent3 ) { ctx.beginPath(); ctx.moveTo(ds.r,ds.ry); ctx.arc(ds.r,ds.ry,ds.cr,ds.startAngle+percent3,tmpAngle); ctx.fillStyle = ds.p4; } else{ ctx.beginPath(); ctx.moveTo(ds.r,ds.ry); ctx.arc(ds.r,ds.ry,ds.cr,ds.startAngle,tmpAngle); ctx.fillStyle = ds.p1; } ctx.closePath(); ctx.fill(); requestAnimationFrame(drawCircle); } this.toDraw = function(){ ds= defaultStyle(dom_circle,canvas); // console.log(tmpAngle); // console.log(ds.xAngle) ctx.clearRect(ds.x,ds.y,canvas.width,canvas.height); drawCircle(); } this.toDraw(); var self = this; window.onresize = function(){ self.toDraw() } } })(window); </script> (编辑:ASP站长网) |


 MySQL IS NULL如何查
 最简单的创建 MySQL
 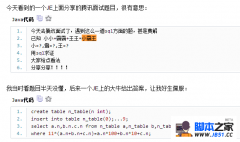 网上看到的给大家分享
 MYSQL教程MySql 5.6.3